BSMS205 · Genetics
Transmission
Chapter 9 · Part II · Variation
Welcome to Chapter nine. In Chapter eight we built the vocabulary for genetic variants — what they look like, the different types, how we classify them. Today we ask the obvious next question. Where do those variants actually come from? You carry roughly four to five million variants compared to the reference genome. Some you inherited from your parents. A small number are brand new — they appeared for the first time in you. This chapter is about both routes, and about a striking finding from large family studies in Iceland and elsewhere that reshaped how we think about mutation, age, and disease risk.
A question to start with
You have ~4 million variants.Where did they come from?
Hold this question in your head for the next hour. You have somewhere between four and five million genetic variants compared to the reference genome. That is a big number. But here is the thing — it did not all appear out of nowhere. Almost every single one of those variants was already present in one of your parents. They have been traveling through your family, through your ancestors, for hundreds, thousands, sometimes millions of years. A tiny fraction, however, is genuinely brand new. Those are mutations that occurred for the first time in you, during the formation of the sperm or egg that made you. Today is about telling those two stories apart.
Two sources · two very different stories
Inherited
~99.98% of your variants
Already in mom or dad
Travel through populations
Follow Mendel's laws
De novo
~0.02% of your variants
Not in either parent
Brand new in you
~70 per generation
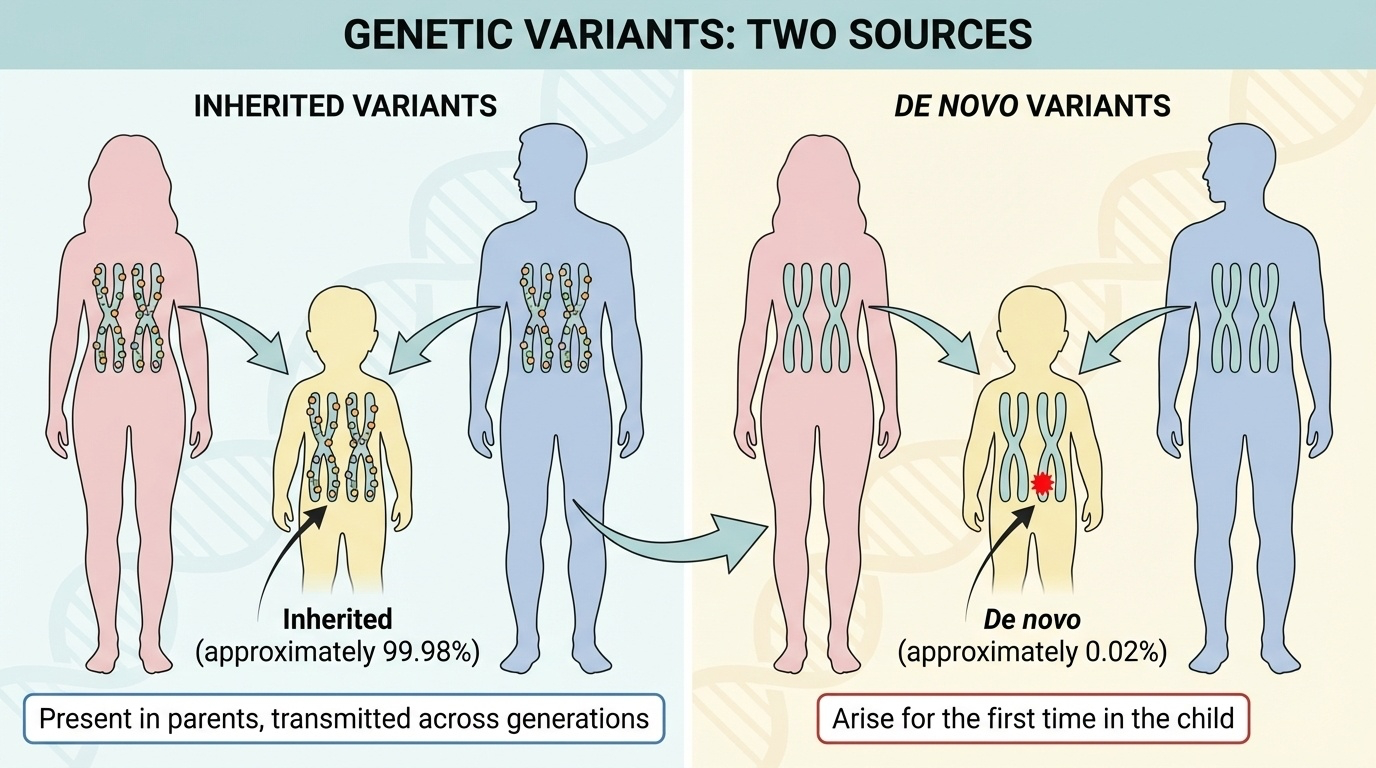
Two sources. Inherited variants make up about ninety-nine point nine eight percent of your variation. They came from your parents — already present in their genomes, transmitted through sperm and egg. They follow Mendel's laws, which means at every position you randomly received one chromosome copy from each parent. The other category, de novo variants, makes up only about zero point zero two percent — but those few dozen new mutations carry outsized importance for medicine and evolution. They are mutations not present in either parent. They appeared for the first time in you. The typical number is around seventy per generation, though as we'll see today, the technology you use to count them changes the answer.
The picture, in one figure
Figure 1. Two sources of genetic variants. Inherited (~99.98%) follow Mendelian segregation across generations. De novo (~0.02%) arise newly during gametogenesis or early embryogenesis — not in either parent.
Here is the picture in a single figure. On one side, inherited variants — they appear in mom, in dad, in you, in your siblings, in grandparents. They flow forward and backward across generations. On the other side, de novo variants — they appear for the first time in you, sometimes in your sibling, but not in either parent. Same molecules, same chemistry. Two completely different evolutionary trajectories. One has been filtered by selection for thousands of generations. The other has not faced selection at all yet.
A memorable hook
Every year your father ages,1.5 more mutations.
A 40-year-old father transmits ~30 more new mutations than a 20-year-old father.
I'll give you the most memorable finding right at the start, because it will help you anchor everything else. Every additional year of your father's age at conception transmits about one and a half new mutations to you. That is the paternal age effect. A forty-year-old father, compared to a twenty-year-old father, transmits roughly thirty extra de novo mutations. Your mother's age also matters, but contributes only about zero point four mutations per year. By the end of this lecture, you'll understand exactly why the difference is so dramatic — and it comes down to a basic difference in how sperm and eggs are made.
Roadmap for today
Inherited variants and Mendelian segregation
Identity by descent · what relatedness looks like
Recombination · mosaic chromosomes
De novo variants · what they are, why they matter
The paternal age effect · biology and math
Landmark studies · Iceland and the long-read revolution
Clinical implications & summary
Here is how we will move today. First, we cover inherited variants — Mendel at the DNA level. Then identity by descent, or I B D, which lets us measure relatedness directly from sequence. Then recombination, which shuffles parental chromosomes before transmission. Then we shift to de novo variants — what they are, where they come from, and why they cause many severe pediatric conditions. Then the paternal age effect, which is the dominant signal in the data. Then the landmark Icelandic studies and the recent long-read revolution from the Porubsky group. And finally, clinical implications and a summary. Let's start with what your parents handed you.
§ 1
Inherited
Let's start with the ninety-nine point nine eight percent — the variants you inherited from your parents. The mechanics of how this works are exactly Mendel's laws, but seen at the level of single base pairs instead of pea-plant phenotypes. Three concepts to cover: segregation at heterozygous sites, identity by descent, and recombination.
Mendelian segregation · at the DNA level
You got one chromosome copy from each parent at every position
At heterozygous parental sites: random 50/50
At homozygous parental sites: deterministic
Mother A/G · Father G/G
Mendelian segregation at the D N A level looks like this. At every single position in your genome, you received one chromosome copy from each parent. If a parent is heterozygous — say mom carries an A on one chromosome and a G on the other — then which one you receive is a fifty-fifty random draw. If a parent is homozygous, like a father who is G slash G, then you definitely receive a G from him. These probabilities multiply across positions. A single C F T R variant transmitted at fifty percent — that is Mendel's law of segregation, written directly in nucleotides. No experimental crosses needed; we read it from a sequencer.
Identity by descent · IBD
When you inherit a DNA segment from a relative,exact copy — identical by descent.
Quantifies relatedness directly from DNA
Foundation of consumer genetics & forensics
Shared segments shrink with each generation
Now identity by descent, or I B D. The idea is simple but powerful. When you inherit a stretch of D N A from a relative, you receive an exact copy of that stretch — the same letters, position by position. Two people share a segment I B D when they both inherited it from a recent common ancestor. This is the foundation of every consumer genetics service — twenty three and Me, AncestryDNA — and it is also how forensic genetic genealogy works. The further back you go in the family tree, the smaller and rarer the shared segments become, because each generation cuts them down by recombination.
How much DNA do relatives share?
Relationship % IBD shared Why
Parent–child 50% One chromosome copy from them everywhere Full siblings ~50% (varies) Each randomly drew one of two parental chromosomes Grandparent–grandchild ~25% Two generations of 50% transmission First cousins ~12.5% Four meiotic steps from common ancestor Second cousins ~3.1% Six meiotic steps
Here are the I B D percentages for common relationships. Parent–child, exactly fifty percent — you received one copy from them at every position. Full siblings, fifty percent on average, but it varies. Grandparent–grandchild, about twenty-five percent — half of fifty. First cousins, around twelve and a half percent. Second cousins, around three percent, where the signal starts to get noisy and harder to detect. Notice the parent–child number is exact, but every other relationship has a variance, because recombination plays a stochastic role at each meiosis.
Why siblings are not exactly 50% identical
At each position, both you and your sibling drew a parental chromosome
Three outcomes, three probabilities:
Outcome Probability Sharing
Same from both parents 25% Identical Same from one parent 50% Half-identical Different from both 25% Non-identical
Average 50% — actual range typically 45–55% .
Siblings are an interesting case. They average fifty percent I B D — but it is an average, and the variation is wider than people expect. At each position, both you and your sibling each randomly drew one of two parental chromosomes. Twenty-five percent of the time you both pulled the same one from both parents — fully identical at that spot. Fifty percent of the time you matched on one parent only — half-identical. And twenty-five percent of the time, you pulled the alternate from both parents — non-identical at that position. Average across the genome, that gives fifty percent. But the actual sibling-to-sibling number for a real pair typically falls between forty-five and fifty-five percent. So one sibling pair can be genuinely more genetically similar than another.
Mendelian segregation & IBD, in one figure
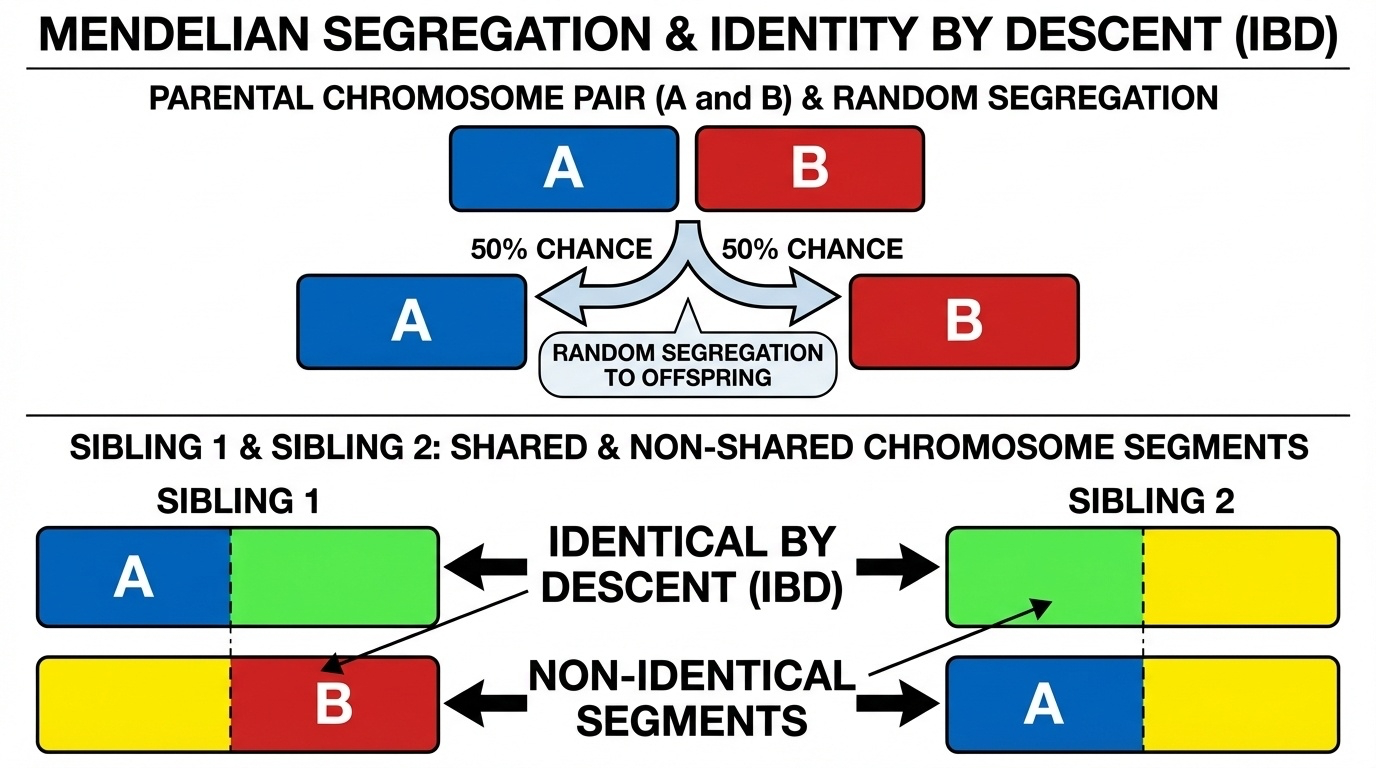
Figure 2. Each parent randomly transmits one of two chromosomes (50/50) at every position. Siblings inherit different combinations, producing shared and non-shared segments. Average IBD ≈ 50%, observed range ≈ 45–55%.
Here is the picture. Each parent's two chromosomes are different colors. At each position one of them is randomly chosen for transmission. Two siblings each go through that random draw independently. The result is a chromosome painting where some segments match between the siblings — those are I B D, inherited from the same parental chromosome — and other segments don't match. Stitch this across all twenty-three pairs and the average lands at fifty percent. Notice this is exactly Mendel's first law, operating on whole chromosomes.
Recombination · chromosomes are mosaics
Chromosomes do not pass to you intact
Meiosis: crossing over shuffles segments
Your mother's chr-1 = mosaic of her parents' chr-1s
~1–2 crossovers per chromosome per generation
And now the third piece — recombination. This is the big subtle one. Chromosomes do not pass intact. During meiosis, before the egg or sperm is finished, there is an event called crossing over. The two parental copies of each chromosome physically swap segments. So the chromosome one your mother passed to you is not actually her mother's chromosome one or her father's — it is a mosaic. A piece from her mother, then a piece from her father, then back to her mother again. Typically there are one or two crossovers per chromosome per generation. That sounds small, but multiplied across twenty-three chromosomes and many generations, it produces the rich shuffling that makes every sibling unique.
Recombination creates mosaic chromosomes
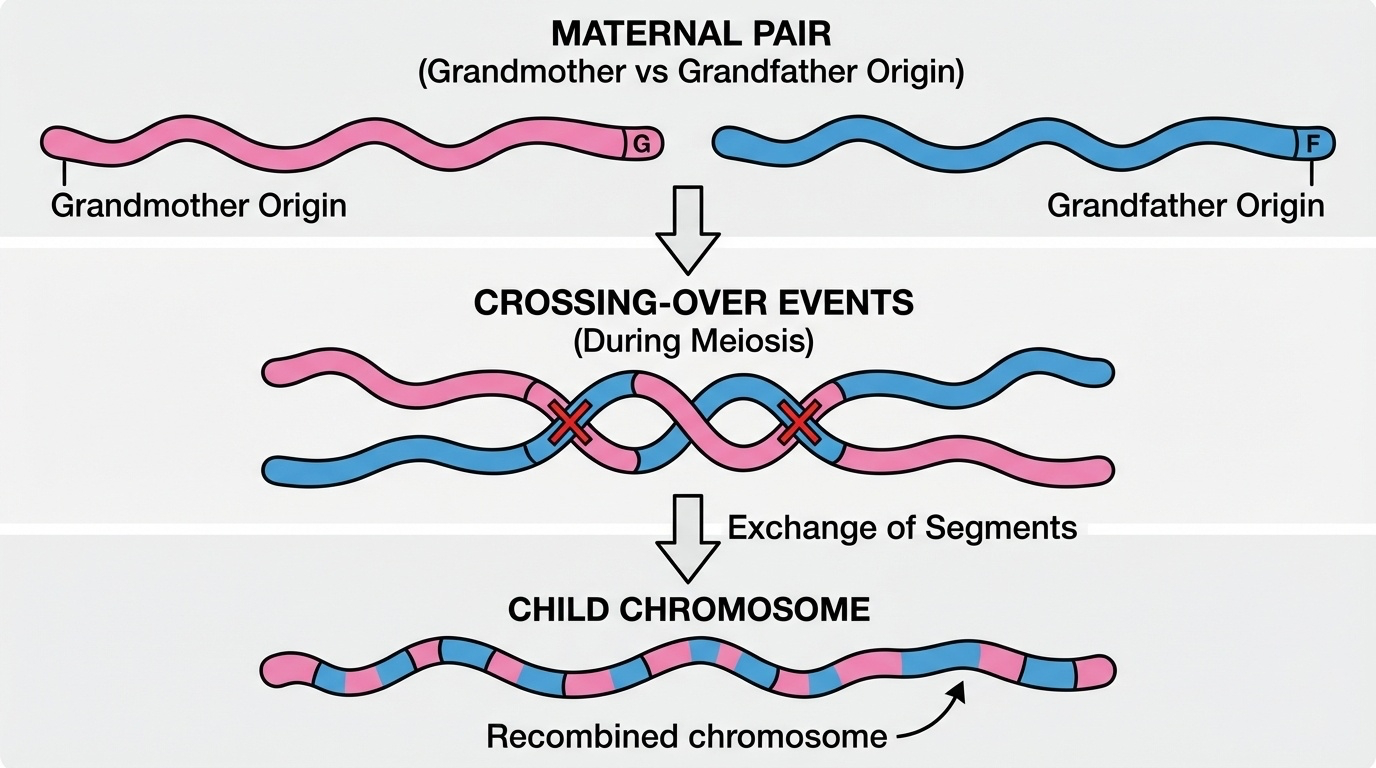
Figure 3. During meiosis, crossing over exchanges segments between the two parental chromosomes (one from grandmother, one from grandfather). The transmitted chromosome is a mosaic — creating new allele combinations and sibling diversity.
Here is recombination as a picture. Before your mother passes a chromosome on to you, the two copies inside her — one from each of her own parents — physically exchange segments at one or two points. The chromosome you actually receive is a patchwork. Some pieces of it came from your maternal grandmother, others from your maternal grandfather. This is why even with only a few crossovers per chromosome, sibling diversity is enormous — every sibling gets a different patchwork. Recombination is also why I B D segments shrink over generations. Each meiosis breaks them apart a little more.
Common vs rare inherited variants
Feature Common (>1%) Rare (<1%)
Age Ancient · thousands–millions of years Recent · hundreds–thousands Selection Survived → usually benign May be deleterious Clinical role Complex-trait risk Mendelian disease Example APOE4 · Alzheimer's riskBRCA1 family-specific LoF
One last piece of the inherited story — the difference between common and rare inherited variants. Common variants, frequency above one percent in the population, tend to be ancient. They have been around for thousands or even millions of years. Selection has had plenty of time to filter them, so most are benign or have only subtle effects. Rare variants, below one percent frequency, are typically more recent. They have not yet been filtered by selection. Many cause Mendelian disease, and they are the bread and butter of clinical sequencing. A B R C A one nonsense mutation in a single family is a perfect example. Both kinds are inherited — Mendel's laws — but they live in very different parts of the medical genetics landscape.
§ 2
De Novo
Now the small but mighty zero point zero two percent. De novo variants are mutations that did not come from either parent. They appeared for the first time in you. Numerically, they are a tiny fraction. Clinically and evolutionarily, they punch far above their weight.
What are they?
Mutations not present in either parentArose during gametogenesis (sperm/egg formation), or
Arose postzygotic (early embryo) → mosaicism
Found by trio sequencing (child + mom + dad)
De novo variants are mutations present in you but absent in both parents. There are two main timing windows. First, during gametogenesis — when sperm or eggs are being made. The vast majority of de novo variants happen here. Second, postzygotic — after fertilization, in the early embryonic divisions. Postzygotic mutations create what we call mosaicism, because they only exist in some of your cells, not all of them. We find de novo variants by trio sequencing — sequencing the child plus both parents, and looking for variants present in the child that are absent in both mom and dad.
How many per person?
~70
de novo single-nucleotide variants (typical short-read estimate)
Long-read sequencing reveals ~100–200 total mutations
Adds repetitive DNA invisible to short reads
Plus indels and structural variants
How many de novo variants per person? The typical short-read sequencing estimate is around seventy single-nucleotide variants — that is the number you'll see in most textbooks and most clinical reports. But that number is incomplete. Recent long-read studies show the true total is closer to one hundred to two hundred when you include mutations in repetitive D N A that short reads cannot see, plus small insertions and deletions, plus structural variants. So the headline number depends on the technology. We'll come back to this when we look at the Porubsky study.
Why de novo variants matter
Engine of new variation — every common variant started hereCause severe disorders — autism, achondroplasia, schizophrenia riskWindow into replication biology — mutation patterns reveal repair
Today's polymorphisms
Three reasons de novo variants matter. One — they are the engine of new genetic variation. Every single common polymorphism in the population today started life as a de novo mutation in some individual long ago. Evolution requires this stream of new mutations to operate on. Two — they cause many severe pediatric disorders. Autism spectrum disorder has a strong de novo component in genes affecting brain development. Achondroplasia, the most common form of dwarfism, is almost always de novo because affected individuals historically rarely reproduced. Schizophrenia risk is correlated with paternal age, which we'll see is a clue about its de novo origin. Three — they teach us biology. Studying where mutations occur reveals how D N A replication and repair actually work in real cells.
§ 3
The Paternal
Now the biggest single signal in this entire field. Father's age at conception is the dominant factor in de novo mutation rate. Mother's age contributes too, but only a fraction as much. Why? It comes down to how sperm and eggs are actually produced — a very simple, very stark biological asymmetry.
Sperm vs egg · a fundamental asymmetry
Oogenesis (♀)
All eggs made before birth
Arrested until ovulation
~23 cell divisions total
Minimal age effect
Spermatogenesis (♂)
Starts at puberty
Continuous · throughout life
Divisions every ~16 days
Strong age-dependent effect
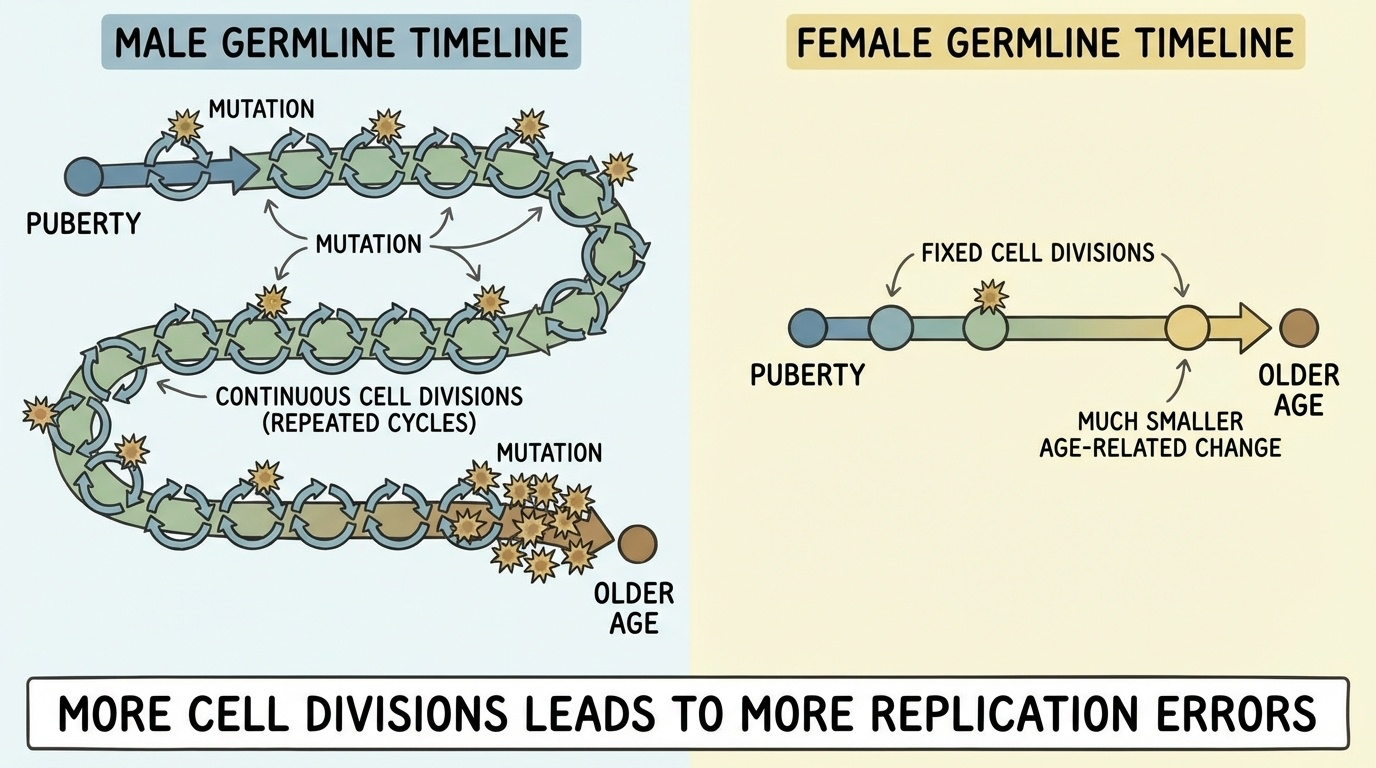
Here is the asymmetry. Oogenesis — egg formation — is essentially finished before a girl is even born. The cells that will eventually become eggs go through about twenty-three cell divisions, and then they sit, arrested, sometimes for forty years, until ovulation. Almost no replication happens after birth. So mom's eggs accumulate very few replication errors with age. Spermatogenesis is the opposite. Sperm production starts at puberty and continues throughout life. The spermatogonial stem cells divide roughly every sixteen days. So by the time a man is forty, his stem cells have divided hundreds of additional times compared to a man who is twenty. Each division is an opportunity for replication errors. That is the entire engine of the paternal age effect.
The math · sperm cell divisions by age
Father's age Approx. sperm cell divisions
20 years ~150 30 years ~230 40 years ~330 50 years ~430
Each division = one opportunity for a replication error .
Here is the math, broken out. A sperm cell from a twenty-year-old father has gone through roughly one hundred fifty divisions since the man was an embryo. By age thirty, that number is up to about two hundred thirty. By forty, three hundred thirty. By fifty, four hundred thirty. Each one of those divisions is an opportunity for the polymerase to make a mistake that will not get fully corrected. Compare that to oogenesis, which clocks in at about twenty-three divisions, total, full stop. That single number — divisions — drives almost everything you see in the data.
The paternal age effect, in one figure
Figure 4. Continuous spermatogenesis means each year of paternal age adds ~1.5 de novo mutations. Oogenesis is essentially complete before birth, so maternal age adds only ~0.4 mutations per year.
Here is the picture. Two lines, both showing de novo mutations transmitted to a child as a function of parent age. The paternal line is steep — about one and a half new mutations per year of father's age. The maternal line is shallow — about zero point four mutations per year. Both go up with age, but the paternal slope is roughly four times steeper. The biological cause is the asymmetry on the previous slide. The number-of-divisions equation drives everything.
Parent-of-origin · 75–81% paternal
~4 : 1
paternal-to-maternal ratio of de novo mutations
Father contributes ~55 SNVs (avg)
Mother contributes ~14 SNVs (avg)
Direct consequence of division counts
Confirmed across many studies
Here is the parent-of-origin breakdown. Roughly four out of every five de novo mutations come from the father. Father contributes around fifty-five single-nucleotide variants on average. Mother contributes around fourteen. So three quarters to four fifths of de novo mutations are paternal in origin. This ratio has been confirmed across many independent studies, including the long-read work we'll see in a minute. It is a direct consequence of the biology — many more divisions in sperm than in egg means many more replication errors carried forward.
§ 4
Landmark
Now let's look at the data. Three studies, each a milestone. Kong twenty-twelve, the first direct measurement. Jonsson twenty-seventeen, the expanded analysis with more than fifteen hundred families. And Porubsky twenty-twenty-five, the long-read revolution that nearly doubled the count.
Kong et al. 2012 · the first direct count
78 Icelandic families · trio sequencingMutation rate: 1.20 × 10⁻⁸ per base per generation
~63 SNVs per child (father age ~30)
Paternal age effect: +2 mutations / year
Linked to schizophrenia & autism risk
Kong et al, twenty-twelve, in Nature. This was the first direct measurement of the human de novo mutation rate from family sequencing. Seventy-eight Icelandic families — Iceland is a goldmine for this kind of work because of well-kept genealogical records. They reported a mutation rate of one point two times ten to the minus eight per base per generation. About sixty-three new single-nucleotide variants per child for a thirty-year-old father. They found the paternal age effect was about two mutations per year. And — crucially — they linked older fatherhood statistically to schizophrenia and autism risk. That paper anchored the entire field.
Jónsson et al. 2017 · the expanded view
1,548 trios · 20× larger than Kong 2012Paternal effect: +1.51 / year (refined down from +2)
Maternal effect: +0.37 / year — newly detected
Regional hotspots : 50× higher maternal C>G on chr-8p~75–81% paternal origin confirmed
Jonsson et al, twenty-seventeen, also from the Iceland group. Twenty times more families — fifteen hundred forty-eight trios. They refined the paternal effect from two per year down to about one point five one per year. They detected a real maternal age effect for the first time, at zero point three seven per year — about four times weaker than paternal. And they found something genuinely surprising. Certain regions of the genome — a twenty-megabase block on chromosome eight p, for example — show up to fifty-fold higher maternal C-to-G mutation rates. That suggests aging eggs have local mutational processes, possibly tied to double-strand-break repair, that aging sperm don't. It's a striking regional pattern that nobody had predicted.
Porubsky et al. 2025 · the long-read revolution
Multi-generation CEPH 1463 pedigree · 4 generations
Long-read sequencing across the full genome
98–206 total mutations per child — nearly double prior counts~16% are postzygotic (mosaic) — no parent bias
Hotspots in tandem repeats, centromeres, segmental duplications
And the most recent landmark — Porubsky et al, twenty-twenty-five, in Nature. They used long-read sequencing on the famous C E P H fourteen sixty-three pedigree, four generations of a single family. Long reads can see into repetitive D N A that short reads can't, and this is where the prior counts had been blind. Total mutation count came out at ninety-eight to two hundred six per child — nearly double what short-read methods had reported. They also found that about sixteen percent of those mutations are postzygotic — meaning they arose after fertilization, in the early embryo. Postzygotic mutations show no paternal bias, because they happen in the embryo's own dividing cells. And they identified specific hotspot regions — tandem repeats, centromeres, segmental duplications — where mutations recur far more often than elsewhere.
The CEPH 1463 pedigree · four generations
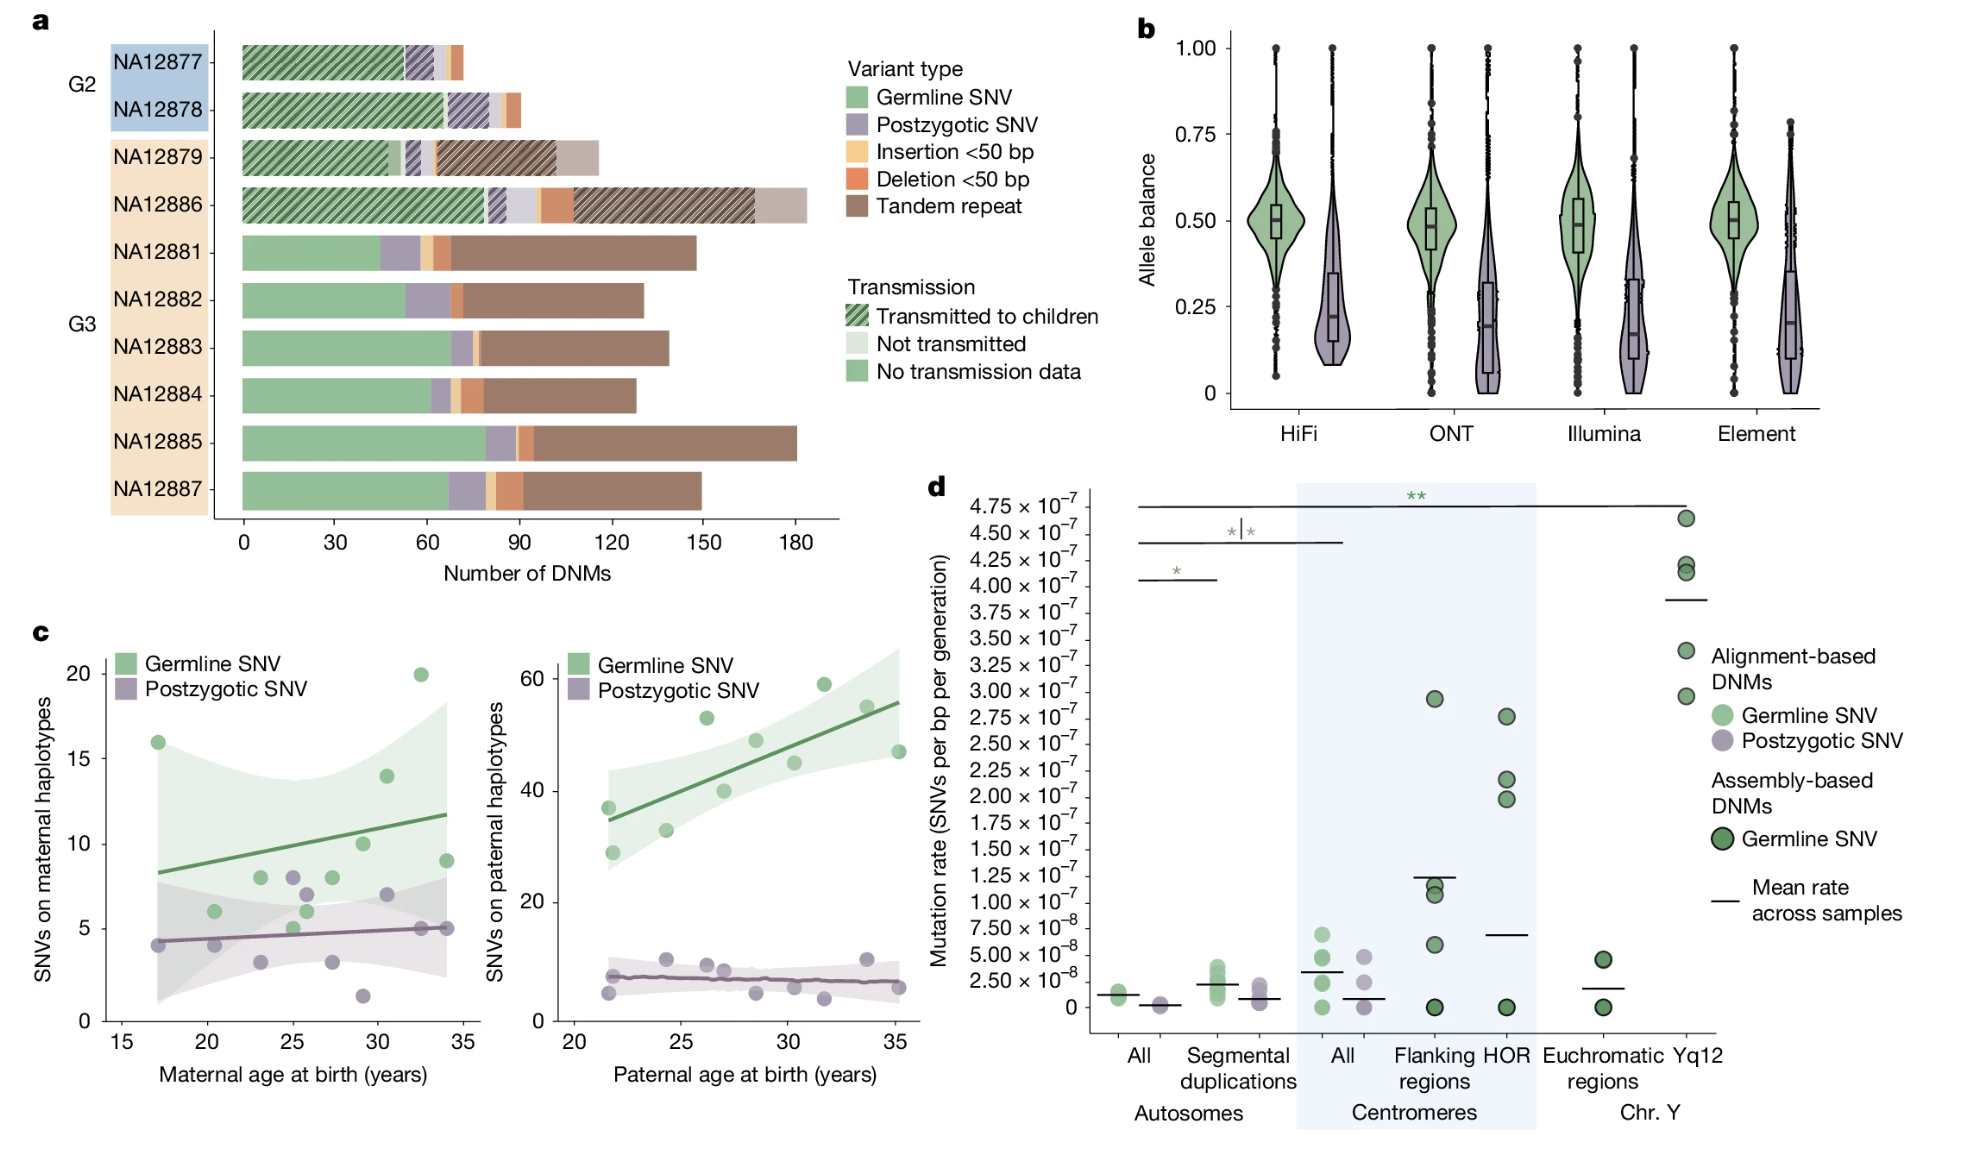
Figure 5. Porubsky et al. 2025 (CC-BY 4.0). Long-read sequencing of a four-generation pedigree. Germline SNVs cluster at allele balance ≈ 0.50; postzygotic mutations sit below 0.25. Strong paternal age effect for germline mutations (~+1.55/year), none for postzygotic. Repetitive regions show large excess.
Here is the picture from the Porubsky paper. Four generations sequenced with long reads. Panel A shows the counts of germline mutations versus postzygotic mutations versus indels, broken down by individual. Panel B shows allele balance — germline mutations sit right at zero point five zero, exactly what you'd expect for a true heterozygous variant transmitted at fertilization, while postzygotic mutations sit below zero point two five because they only exist in some cells. Panel C shows the paternal age effect — about plus one point five five mutations per year for germline, but flat for postzygotic. And panel D shows that repetitive regions have far more mutations per base than unique regions. This figure is the current gold standard for what we know about human de novo mutation.
Three studies · same picture, sharper resolution
Study N families Tech Paternal effect
Kong 2012 78 Short-read +2 / year Jónsson 2017 1,548 Short-read +1.51 / year Porubsky 2025 4-gen pedigree Long-read +1.55 / year
Estimate of ~1.5 mutations per paternal year has held up across technologies.
Three studies, increasing scale, increasingly accurate. Kong twenty-twelve, seventy-eight families, two mutations per paternal year. Jonsson twenty-seventeen, fifteen hundred families, refined down to one point five one. Porubsky twenty-twenty-five, four-generation pedigree with long reads, one point five five. The estimate of about one and a half mutations per paternal year has held up beautifully across two decades and three different sequencing technologies. That is the kind of robustness that turns a finding into a textbook fact.
§ 5
Clinical
How does any of this matter in the clinic? Two main places — counseling on paternal age, and identifying de novo variants in children with disease. Let's go through each.
Paternal age & mutation burden
Father's age Extra mutations vs age 20 Relative increase
<30 ~0–15 baseline 30–40 +15 to +30 ~35% 40–50 +30 to +45 ~70% >50 +45 to +60+ >100%
Most are harmless — but disease risk for specific conditions does rise.
Here is what the paternal age numbers translate to in practice. A father over fifty transmits roughly sixty more mutations than a father at age twenty — that is more than a hundred percent increase over baseline. Now the important caveat: most of these extra mutations are harmless. They land in non-functional regions, or they are silent, or selection will quietly handle them. But specific conditions — schizophrenia, autism, achondroplasia, Apert syndrome — show genuine increased incidence with paternal age, because they require a single de novo hit in a sensitive gene. So the conversation in genetic counseling is nuanced: more mutations, but most don't matter clinically.
Trio sequencing · the standard workflow
Sequence: child + mother + fatherchild , absent in both parents
The workflow for finding de novo variants. Sequence the child and both parents. Identify variants present in the child but absent in both parents. Apply quality filters — depth above twenty, allele balance between thirty and seventy percent, high mapping quality. Then prioritize the candidates that look biologically meaningful — loss-of-function variants or damaging missense variants in genes already linked to the patient's phenotype. This trio approach is standard in pediatric clinical sequencing today, and it is how a substantial fraction of severe developmental disorders get diagnosed.
Watch out · false positives & mosaicism
Sequencing errors can mimic de novo variantsParental mosaicism : low-level mutation in some parental cellsSame variant may appear de novo in multiple children
Critical for recurrence-risk counseling
Apparent de novo ≠ truly de novo
Two very important caveats. First, sequencing errors at low coverage can look exactly like de novo variants — that is why we apply strict quality filters and often validate clinically reportable variants by Sanger sequencing or P C R. Second, and arguably more important clinically, parental mosaicism. If a parent carries the mutation in some of their cells but not others — say in a fraction of their germline — the variant looks de novo when you sequence parental blood, because blood D N A is mostly variant-free. But the recurrence risk in future siblings is no longer one in seventy million; it could be five percent, ten percent, sometimes higher. So before counseling a family on recurrence, it is essential to look hard for parental mosaicism with sensitive sequencing.
Inherited vs de novo · summary table
Feature Inherited De novo
Per genome ~4–5 million ~70–200 Source Parents' genomes New mutations Age Ancient–recent Brand new Detection Standard variant calling Trio sequencing Inheritance Mendelian Not transmitted from parents Selection filter Already filtered Not yet filtered Clinical role Common → complex; rare → Mendelian Severe developmental disorders
And here is the side-by-side summary, all in one table. Inherited variants — millions of them, ancient or recent, from your parents' genomes, follow Mendelian rules, already filtered by selection. De novo variants — only dozens to a couple hundred, brand new, not in either parent, found by trio sequencing, and not yet faced any selective pressure. Clinically, inherited common variants drive complex traits, inherited rare variants drive Mendelian disease, and de novo variants are major contributors to severe pediatric developmental disorders. Two categories, very different roles.
§ 6
Summary
Let's pull the threads together.
What to take away
Variants come from two sources : inherited (~99.98%) & de novo (~0.02%)
Inheritance follows Mendel ; recombination creates mosaic chromosomes
~70 de novo SNVs per generation (short-read); ~100–200 with long-read~1.5 mutations / paternal year · ~0.4 / maternal year75–81% paternal origin · driven by continuous spermatogenesisTrio sequencing finds them; parental mosaicism is the catch
Six things to take away. One — variants in your genome come from two sources, inherited from parents at about ninety-nine point nine eight percent, and de novo at about zero point zero two percent. Two — inheritance follows Mendel's laws at the D N A level, and recombination during meiosis means every chromosome you carry is actually a mosaic of grandparental segments. Three — typical short-read counts give about seventy de novo single-nucleotide variants per child; long-read sequencing nearly doubles that count. Four — paternal age adds about one point five mutations per year, maternal age about zero point four. Five — three quarters to four fifths of de novo mutations come from the father, driven by continuous sperm cell divisions throughout life. Six — clinically, trio sequencing identifies de novo variants in children, but you must always check parents for mosaicism before counseling on recurrence risk.
Next lecture
We know how variants arise.one variant
Chapter 10 · Dominant Alleles & the Logic of Disease
And one question to leave you with for next time. We've now seen what variants are, how they're classified, and how they pass through generations — both inherited and de novo. The next obvious question is: how does a single variant — sometimes just one base change — cause a serious genetic disease? Why is one copy of a variant sometimes enough to dominate the phenotype? That is dominant inheritance, and it is the focus of Chapter ten. See you next time.